Dollar Per WAR 2025/2026 - Fangraphs Perceptions
Fangraphs has released its 2026 free agent crowdsourced contract projections and WAR projections and they show an interesting trend about how the baseball community perceives the value of WAR.
Photo Credit: Michael Reaves/Getty Images

Where Does Superstar Shohei Ohtani Rank in The 2025 xwFIP Leaderboard?
With the League Championship series underway, here is the final xwFIP post of the season!
Photo Credit: Harry How/Getty Images

Why the Cuban Missile Is Having a Career Year
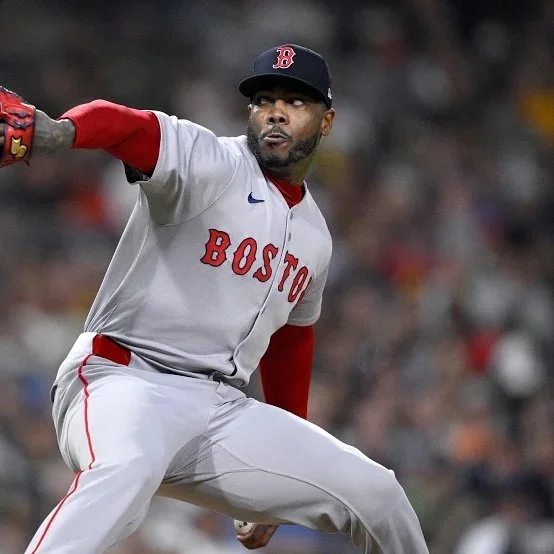
Aroldis Chapman is atop the 2025 xwFIP rankings through August. How is the 37-year-old Red Sox closer having so much success this year?
Photo Credit: Orlando Ramirez/Getty Images

What Were The Top Trade Deadline Pitching Acquisitions?
This year’s trade deadline had a flurry of action up until the last minute. In this post I’ll discuss the top arms that postseason contenders were able to add.
Photo Credit: Brad Penner/Imagn Images

Who is The Best Pitcher in Baseball at the Halfway Point of the Season?
We are halfway through the baseball season! Who is standing out as the best pitcher?
Photo Credit: Thomas Shea/Imagn Images

There’s a Hidden Gem at the Back of the Yankees Rotation
The xwFIP leaderboard for May is out!
Photo Credit: MLB.com

Is Mason Miller Still King?
Just over one month into the MLB season, we have a sample size large enough for our first xwFIP leaderboard of the year. Is Mason Miller still king?

What is The Most Likely March Madness Bracket?
With one of the most exciting tournaments in sports kicking off this week, it’s time to do another analysis with the aim of creating the best March Madness bracket. Last year, my ELO system didn’t do well, so this year I’ll take a look at the betting action on Draftkings and Fanduel to see what the industry consensus most likely bracket is.
Photo Credit: New York Times

On Two-Point Conversion Attempts, Should NFL Teams Run or Pass More?
There have been 2319 two-point conversion attempts over the past 26 NFL seasons (including playoffs), equating to about one two-point attempt in every three games. What is the optimal run/pass distribution in these situations?
Photo Credit: NFL

How To Stop Saquon Barkley??
Eagles running back Saquon Barkley is having one of the best rushing seasons in NFL history. He had the 14th most rushing yards per game in NFL history with 125.3 and the 4th most this century, trailing only Adrian Peterson (131.1 in 2012), Derrick Henry (126.7 in 2020), and Chris Johnson (125.4 in 2009).
How can the Chiefs stop Saquon in the Super Bowl? In this analysis I’ll take a look at Barkley’s rushing patterns to see how the Chiefs should plan against him.
Photo Credit: Mitchell Leff/Getty Images

Who Has Better Post-Season Numbers - Brady or Mahomes?
Earlier this season I posted an analysis comparing Manning, Brady, Mahomes, and Rodgers in order to determine the best quarterback of the QBR era. In this post, I'll focus on a postseason comparison between Brady and Mahomes. Which quarterback has had a bigger impact on his team’s success when it matters most?
Photo Credit: sportingnews.com

What Do the New York Giants Need to Do to Become a Playoff Contender?
The Giants are coming off one of their worst seasons in franchise history, finishing 3-14 and landing the 3rd pick in the 2025 NFL Draft. In this analysis I’ll compare their roster to the NFL’s top 3 regular season teams (Chiefs, Lions, and Eagles) to see which positions they should emphasize in their rebuild in order to make the team a playoff contender.
Photo Credit: Luke Hales/Getty Images

Do NFL Teams Run the Ball Too Often on 2nd and Long?
1st down incompletion, 2nd and 10 upcoming— a clear passing situation, right? After all, only the league's elite ball carriers (just nine this season) can consistently gain 10 yards on the ground over two plays to avoid 4th down. So, what's the better strategy here? Two consecutive pass plays, each designed to pick up 10 yards, or a single pass play, aiming for 5-7 yards after a 2nd down run?
In this analysis, I’ll dive into NFL teams' run/pass decision-making on 2nd down and evaluate whether their play-calling aligns with game theory optimal strategies. Has the league cracked the code or if there’s room for improvement?
Photo Credit: Getty Images

Can Volpe Become a Better Base-Stealer?
With Statcast’s new baserunning and basestealing data released to the public, I wanted to take a look at the top base-stealers in 2024. Yankees shortstop Anthony Volpe increased his stolen base total from 24 in 2023 to 28 this past season. How does he compare to the top base-stealers in the league, and how can we expect him to improve?
Photo Credit: Charles Wenzelberg/New York Post

Man vs. Zone Defense: Which One Is Most Efficient Against Passing Plays?
As the NFL regular season approaches its final week of play, I will take a look at how NFL defenses have performed since 2018 in each of man and zone defense against passing plays. I will use two key metrics—EPA (Expected Points Added) and WPA (Win Probability Added)—to assess team effectiveness.
Photo Credit: USA Today

Dollar/WAR in the 2024/2025 MLB Free Agency Market
Last offseason, I examined the trend in dollar/WAR (wins above replacement) for free agent signings. In this analysis, I’ll revisit the dollar/WAR figures for this year’s free agency market and dive deeper into the evolving spending patterns.
Photo Credit: Marca

How Will Roki Sasaki Fare in the MLB?
23-year-old Japanese phenom Roki Sasaki, a star pitcher for the Chiba Lotte Marines in Nippon Professional Baseball (NPB), has officially been posted for MLB teams to sign. Sasaki is set to become the most cost-effective elite starting pitcher available this offseason due to his international amateur status. Being under 25, he must sign a rookie deal that pays the MLB minimum for three seasons, followed by three years of arbitration before reaching unrestricted free agency—mirroring Shohei Ohtani’s early MLB trajectory.
Last offseason, Yoshinobu Yamamoto was posted and signed by the Dodgers. As some may recall, I did an analysis back then aiming to predict how Yamamoto would fare in the world’s best baseball league. Using that same logic, but adding Yamamoto’s predicted and actual data to my dataset for the model, how is Sasaki projected to perform in the MLB?
Photo Credit: AP

Who is the Best Quarterback in the QBR era: Manning, Brady, Rodgers, or Mahomes?
Total Quarterback Rating (QBR) data exists dating back to 2006 and is largely considered a better measure of quarterback performance than passer rating because QBR accounts for expected points added (EPA) for all plays a quarterback participates in, including sacks and quarterback runs, rather than focusing solely on passing plays.
In this analysis, I will examine the QBRs of Peyton Manning, Tom Brady, Aaron Rodgers, and Patrick Mahomes for each season since 2006. My goal is to identify the top quarterback of the QBR era by assessing how many times each player secured the QBR title and comparing their rolling-peak QBRs from single-season highs to 16-season averages.
Photo Credit: Mike Ehrmann/Getty Images

How Should The Yankees Pitch Against The Dodgers?
A thrilling postseason is approaching its climax—a battle between each league’s juggernaut team. The 27-time champion Yankees are in the World Series for the first time since 2009 and the 7-time champion Dodgers are back in the Fall Classic for the fourth time in the last eight seasons, aiming to secure their first full-season title since 1988. The most common World Series matchup in being renewed for 12th time, the first since 1981 in which the Dodgers beat the Yankees in 6 games. The Yankees have won eight of their eleven World Series meetings, including the first five.
The Dodgers lineup averaged 5.2 runs per game this season (second to only the Diamondbacks). How should the Yankees pitch to them in their attempt at capturing their 28th title?
Photo Credit: Megan Briggs/Getty Images)

Which Batters Swing Least Often and Most Often on First Pitches?
Securing strike one is vital for pitchers, and many hitters prefer to take the first pitch to gauge the pitcher’s release, velocity, and movement. In this analysis, I’ll highlight the 15 batters with the lowest and highest first-pitch swing percentages among all qualified hitters in 2024, and provide tips on how to effectively pitch to them.
Photo Credit: AP Photo/Charlie Riedel